


Mountain View, United States. Google Research unveiled TabFM on 30 June, a foundation model for classification and regression on tabular data. It can work with a new table without separately training its weights, manually engineering features or running a hyperparameter search, according to the Google Research announcement.
That does not mean TabFM was never trained. Google pretrained the model on hundreds of millions of synthetic datasets. Here, zero-shot means that its parameters are not updated for a particular table: labelled examples are supplied at inference time and become the context for the prediction.
Why tables remain a difficult AI problem
Sales records, customer applications, transactions, inventories and medical results are usually stored as rows and columns rather than text or images. Gradient boosting, random forests and other specialised algorithms have dominated this kind of data for years.
A conventional project involves selecting features, handling missing values and categories, training several models, tuning them and validating the result on held-out data. TabFM is designed to shorten that cycle: one pretrained model infers the pattern of a new task from examples shown alongside the rows that need answers.
| Stage | Conventional tabular ML | TabFM |
|---|---|---|
| Task setup | A separate pipeline for each dataset | Training rows are passed as context |
| Model parameters | Updated during training | Unchanged on the new table |
| Tuning | Often requires a hyperparameter search | Base mode uses one forward pass |
| Quality checks | Required | Still required |
How the model reads rows and columns
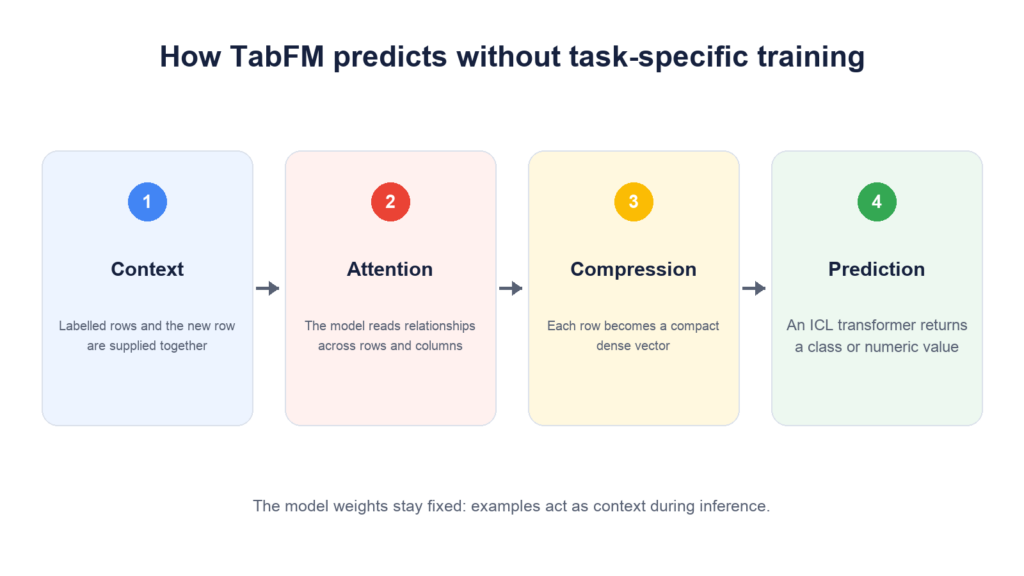
TabFM receives the labelled portion of a table and the rows requiring answers as one input. Its first stage alternates attention across columns and rows, looking for relationships among features and patterns across examples.
It then compresses the information in each row into a dense vector. A 24-block causal ICL transformer operates on the resulting sequence and returns a class or numeric value. The TabFM 1.0.0 model card says the architecture supports both numerical and categorical columns.
The scikit-learn-compatible interface still uses a fit() method, which may look contradictory. The official TabFM repository shows that this call prepares category encoders and numerical scaling; it does not retrain the foundation model’s parameters.
Why Google trained on synthetic tables
Large open collections exist for text and vision models, while industrial tables frequently contain proprietary schemas and personal information. Google addressed that shortage by dynamically generating hundreds of millions of synthetic datasets using structural causal models.
The approach exposes TabFM to many types of feature relationships without using real customer databases. It also creates uncertainty: a synthetic world cannot guarantee complete coverage of rare events, behaviour shifts or domain-specific biases.
What the TabArena ranking showed
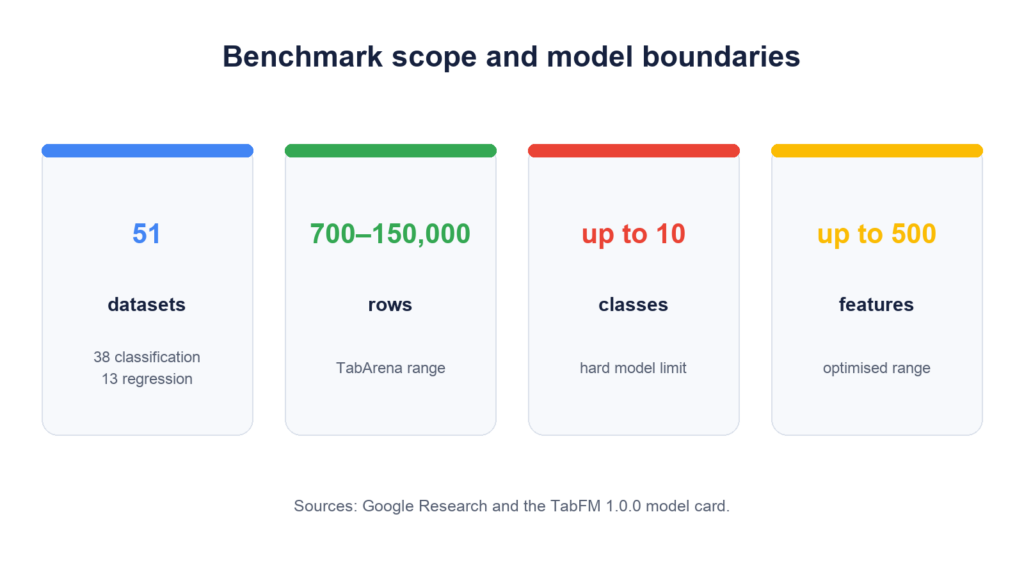
Google evaluated TabFM on the open TabArena benchmark, covering 38 classification and 13 regression datasets with between 700 and 150,000 rows. TabArena calculates Elo ratings from head-to-head comparisons among methods.
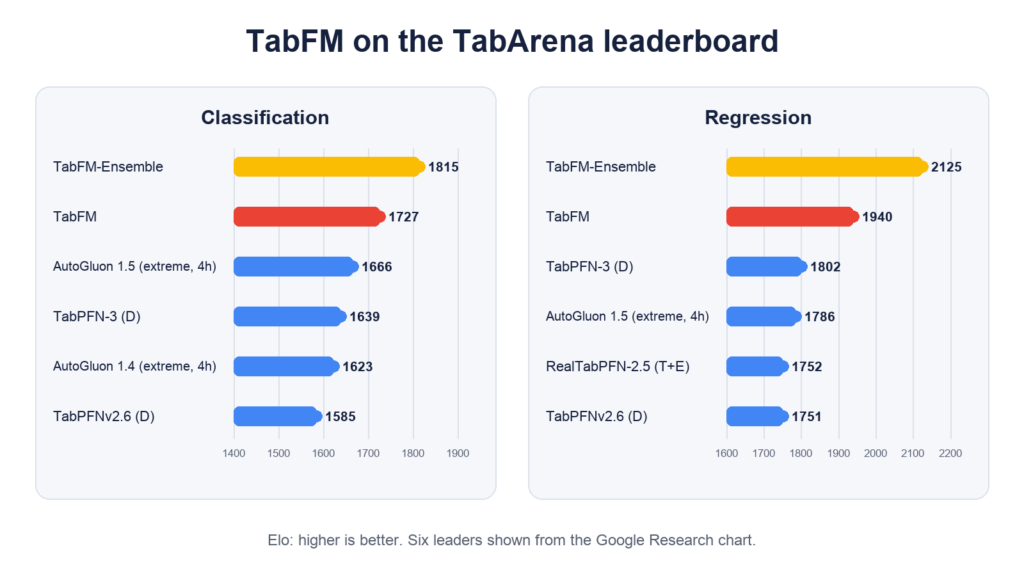
In the chart published by Google, the base TabFM scored 1,727 Elo for classification and 1,940 for regression, placing second in both groups. TabFM-Ensemble ranked first with 1,815 and 2,125 points respectively.
The ensemble is not equivalent to the simplest run. It combines 32 configurations with a non-negative least squares solver, adds cross and SVD features and uses Platt scaling for classification. The base TabFM makes its prediction in a single forward pass without tuning or cross-validation.
Elo is a relative measure, and TabArena is a living benchmark. Leadership in one snapshot does not prove that a model will be best for every business dataset. As seen in other specialised evaluations of AI systems, results depend on the data, metric and testing conditions.
Where the “no training” promise ends
- Labelled examples are still needed. TabFM does not infer a task from nothing; historical rows with known answers form its context.
- Memory use grows with context. All training rows are supplied during inference.
- Classification has a hard limit. The current version supports no more than 10 classes.
- Very wide tables are a risk area. TabFM is optimised for up to 500 features, and behaviour may degrade beyond that range.
- High-stakes decisions require separate validation. Google advises testing on representative held-out data before deployment.
A prediction should be treated as a probability estimate, not a guarantee. The recent case in which 12 AI models unanimously missed a football result illustrates the gap between a plausible calculation and what happens in the real world.
Open code, but not entirely open terms
Google released the TabFM code on GitHub under Apache 2.0 and published JAX and PyTorch weights. The weights themselves carry a separate non-commercial licence. The model card also states that TabFM is not an officially supported Google product.
The company plans to integrate the technology into BigQuery. According to the announcement, users should be able to run classification and regression with an AI.PREDICT SQL command in the coming weeks. Until the function becomes available, this remains an announced plan rather than a current capability.
What TabFM could change in practice
The biggest potential gain is speed to a first prototype. An analyst could quickly test whether a table contains enough signal to predict churn, fraud risk, prices or demand before building a full ML pipeline. That could lower the entry barrier to predictive analytics for smaller teams.
A final decision must still account for source-data quality, target leakage, sampling bias, the cost of errors and changes over time. TabFM removes part of the engineering routine; it does not remove responsibility for formulating the problem correctly.
Sources: Google Research announcement, TabFM repository, TabFM 1.0.0 model card and the TabArena benchmark.
The lead image was created with artificial intelligence for Cifrum.kz as a conceptual editorial illustration. The charts and diagrams were prepared by Cifrum.kz from the cited source data.


Comments on this article